


With the cost of living crisis biting, it’s no surprise that many people across the country are worried about how much disposable income they will be left with - if any - at the end of the month.
The cost of energy has been a particular concern for Brits this year, and unfortunately it doesn't look like the situation will improve any time soon as the autumn and winter months approach. In addition, multiple sources are predicting the new energy price cap increase, which is due to come into effect in October 2022, could push energy costs up even further.
With this in mind, we wanted to explore how much of the nation’s salaries are now going on energy bills each year.
To find out, we sourced the latest available ONS data on average income in 211 locations across England, Wales and Scotland as well as average costs of energy in each region, including gas, electricity and standing charges[1].
We then calculated how much the net (take home) salary in each location would come to after taxes, and how much energy bills could amount to in different regions based on low, medium and high consumption levels, to see how these compare.
[1] Values may not match exactly due to rounding. Figures have been calculated based on an average of low, medium and high consumption levels. Your final bill may vary based on payment and meter type, and additional charges such as operating costs, network costs and VAT.
List of Contents
Why do energy prices vary by area?
Which ares are spending the highest percentage of their salary on energy bills?
Will turning the heating down help?
Which areas are spending the lowest percentage of their salary on energy bills?
What’s the situation like in bigger cities?
How could the situation change with the new energy price cap?
What measures can be taken to soften the blow of rising energy costs?
Why do energy prices vary by area?
The average UK energy bill under the new price cap is around £1,994 for direct debit customers, according to Ofgem. But energy costs vary by region, meaning in some locations the average price will be higher, and in some it will be lower.
There are several reasons why energy costs vary by location. According to Uswitch, these are dependent on how much energy suppliers can sell to customers; how much they buy from the national grid and how much the local distributors charge suppliers in each region.
Additionally, energy can cost more or less to generate depending on availability of renewable energy or fossil fuels in each location, and costs can also be impacted by the demand which is dictated by the size of the customer base compared to the capacity to produce energy.
Which areas are spending the highest percentage of their salary on energy bills?
According to our research, people living in the South West are currently spending the highest percentage of their take-home salary on energy costs – with a typical household bill accounting for 10.47% of the average salary in the region.
While this still always depends on energy usage and method of payments, our research has shown that with an average take home salary of £16,523 per year, and an average energy bill of £2,039 in the region, residents in the rural Rother district in the South East currently spend the highest percentage of their salary on energy bills. This is followed by those in the Cotswold district (South West) (£16,754 average salary vs £2,062 energy bills, which also equates to 12.3%).
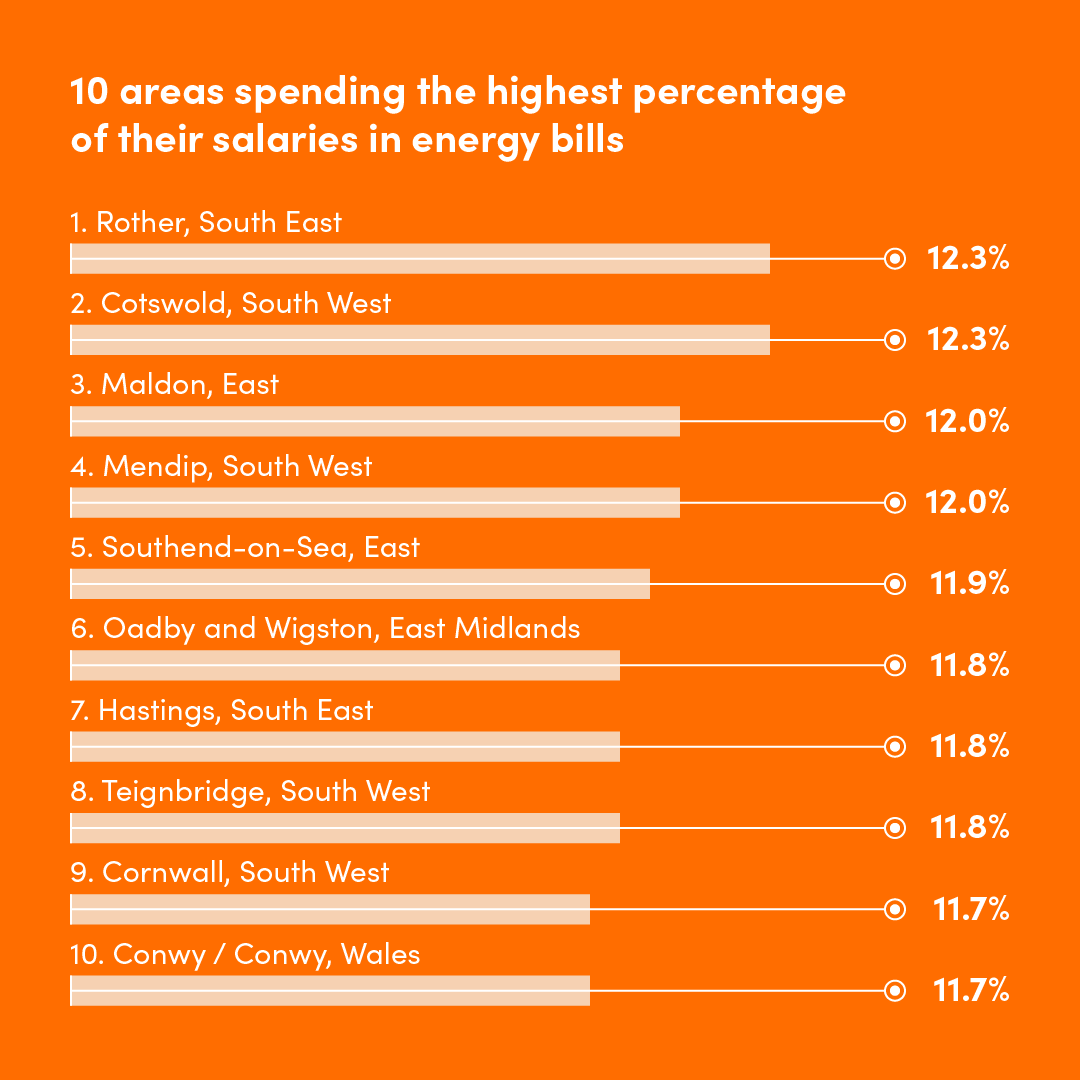
10 areas spending the highest percentage of their salaries in energy bills
1. Rother, South East (12.3%)
2. Cotswold, South West (12.3%)
3. Maldon, East (12.0%)
4. Mendip, South West (12.0%)
5. Southend-on-Sea, East (11.9%)
6. Oadby and Wigston, East Midlands (11.8%)
7. Hastings, South East (11.8%)
8. Teignbridge, South West (11.8%)
9. Cornwall, South West (11.7%)
10. Conwy / Conwy, Wales (11.7%)
While this is an average calculated on a single salary and a total average household bill, even if the cost was split between two people, it would still work out as at least 6% of each adult's annual take-home pay going on energy bills.
Will turning the heating down help?
With prices being so high, households across country may be hoping that reducing consumption will have a significant impact on their total bill at the end of the year.
While this may certainly help to soften the blow, our study has shown that even when consumption levels are kept low, the current high energy prices mean most Brits are likely to be spending at least 7% of their annual take-home salary on their energy bills.
In the areas currently spending the highest percentage of their income on bills, this looks to be around 8% - even for those not using as much gas and electricity.
Which areas are spending the lowest percentage of their salary on energy bills?
While in some other areas of the country the figures look more favourable, even in these locations where people are spending the least amount of money on bills compared to their salary, it's still 7-8% of their income on average.
And this excludes London, where salaries are generally higher compared to the rest of the country.
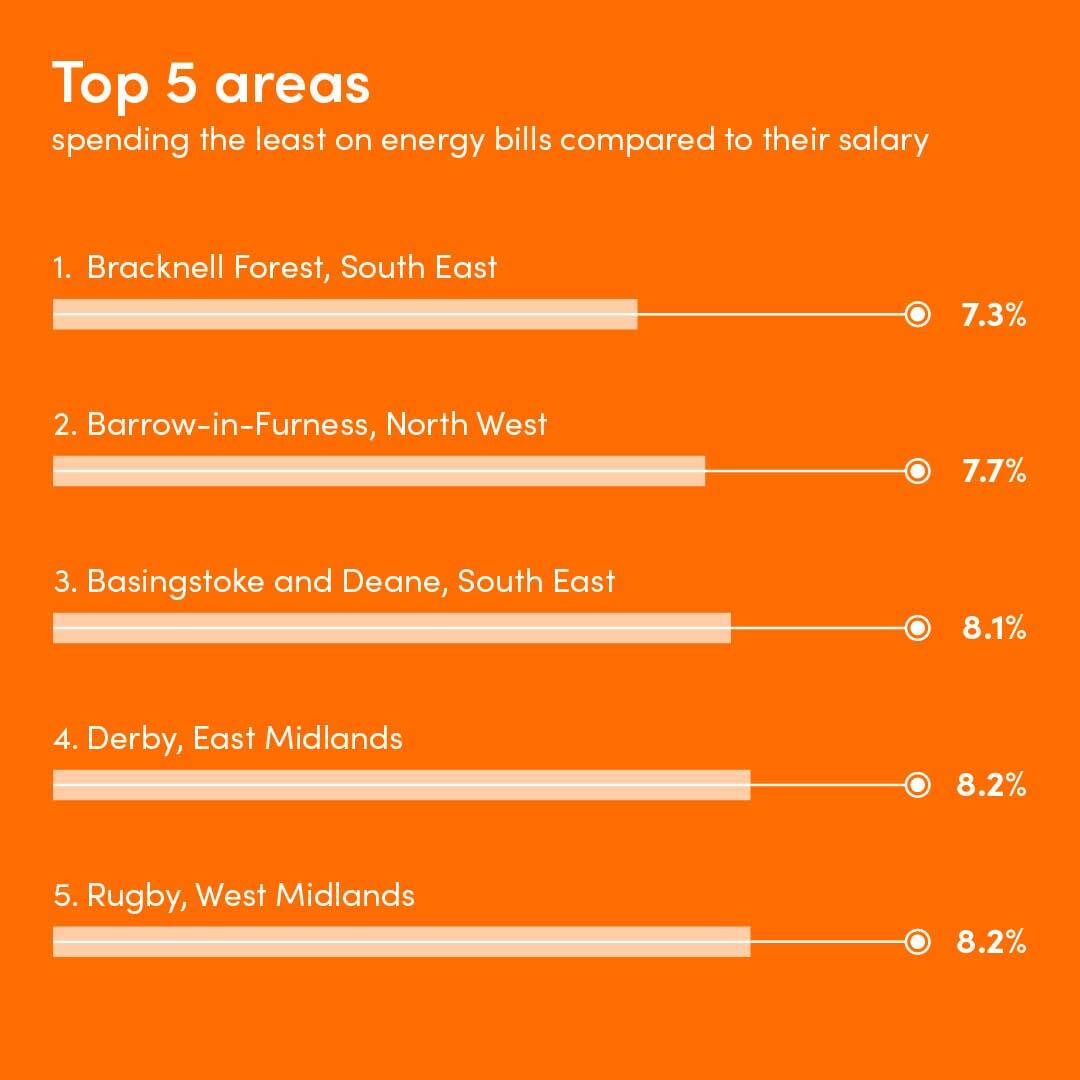
Top five areas spending the least on energy bills compared to their salary (outside of London)
1. Bracknell Forest, South East (7.3%)
2. Barrow-in-Furness, North West (7.7%)
3. Basingstoke and Deane, South East (8.1%)
4. Derby, East Midlands (8.2%)
5. Rugby, West Midlands (8.2%)
What’s the situation like in bigger cities?
When looking at bigger cities specifically, it’s residents in Bradford, West Yorkshire and Sunderland, North East who are forking out the highest percentage of their take-home pay on energy bills currently.
In fact, residents in these cities are currently spending 10.5% of their income on heating and energy, followed by those in Preston and Leicester (10.3%).
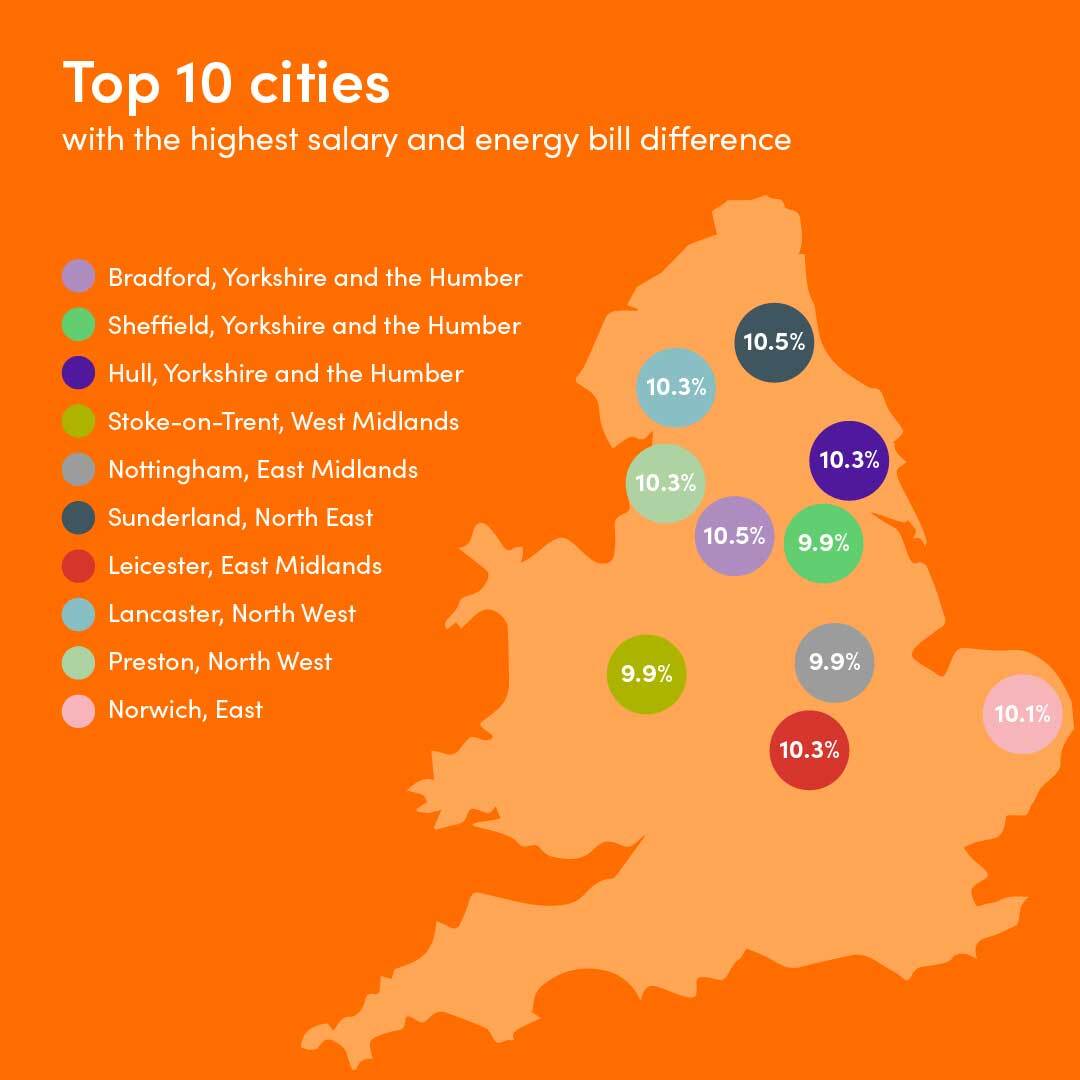
Top 10 cities with the highest salary and energy bill difference
1. Bradford, Yorkshire and the Humber (10.5%)
2. Sunderland, North East (10.5%)
3. Preston, North West (10.3%)
4. Leicester, East Midlands (10.3%)
5. Hull, Yorkshire and the Humber (10.3%)
6. Lancaster, North West (10.3%)
7. Norwich, East (10.1%)
8. Sheffield, Yorkshire and the Humber (9.9%)
9. Stoke-on-Trent, West Midlands (9.9%)
10. Nottingham, East Midlands (9.9%)
London residents seem to be at the lower end of the table. Perhaps unsurprisingly, due to higher average salaries, those living in the City spend just 4.7% of their income on bills on standard consumption levels, and up to 6.40% when looking at higher consumption levels.
This seems to be the case in other areas of London, too. Tower Hamlets residents spend 6.3% of their salary on bills, the second-lowest overall, with Islington slightly above (6.8%).
When it comes to other cities outside of the capital, residents in Derby, East Midlands currently have the most favourable balance between take home pay and average energy bills, at 8.2%.
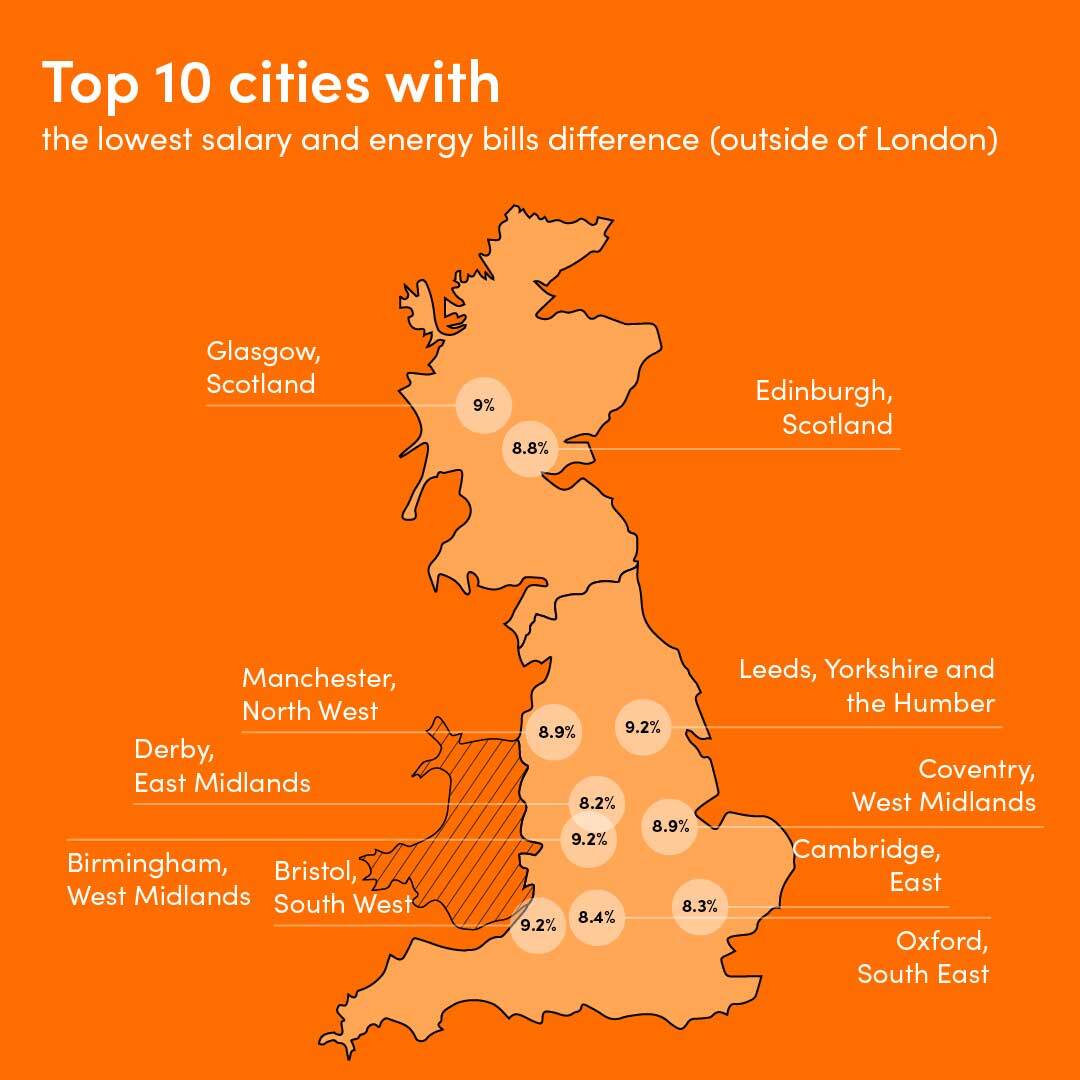
10 cities with the lowest salary and energy bills difference (outside of London)
1. Derby, East Midlands (8.2%)
2. Cambridge, East (8.3%)
3. Oxford, South East (8.4%)
4. Edinburgh, Scotland (8.8%)
5. Manchester, North West (8.9%)
6. Coventry, West Midlands (8.9%)
7. Glasgow, Scotland (9%)
8. Leeds, Yorkshire and the Humber (9.2%)
9. Bristol, South West (9.2%)
10. Birmingham, West Midlands (9.2%)
How could the situation change with the new energy price cap?
Note: This study was updated following the new Ofgem energy price cap announcement on the 26th of August 2022.
The new energy price cap increase coming into effect in October could mean a staggering 80% increase in energy bills across the UK. While the final bill always depends on usage, location and method of payment, this will mean that some of the locations with the biggest disparity between average salary and average energy bill right now, could see this increase even further.
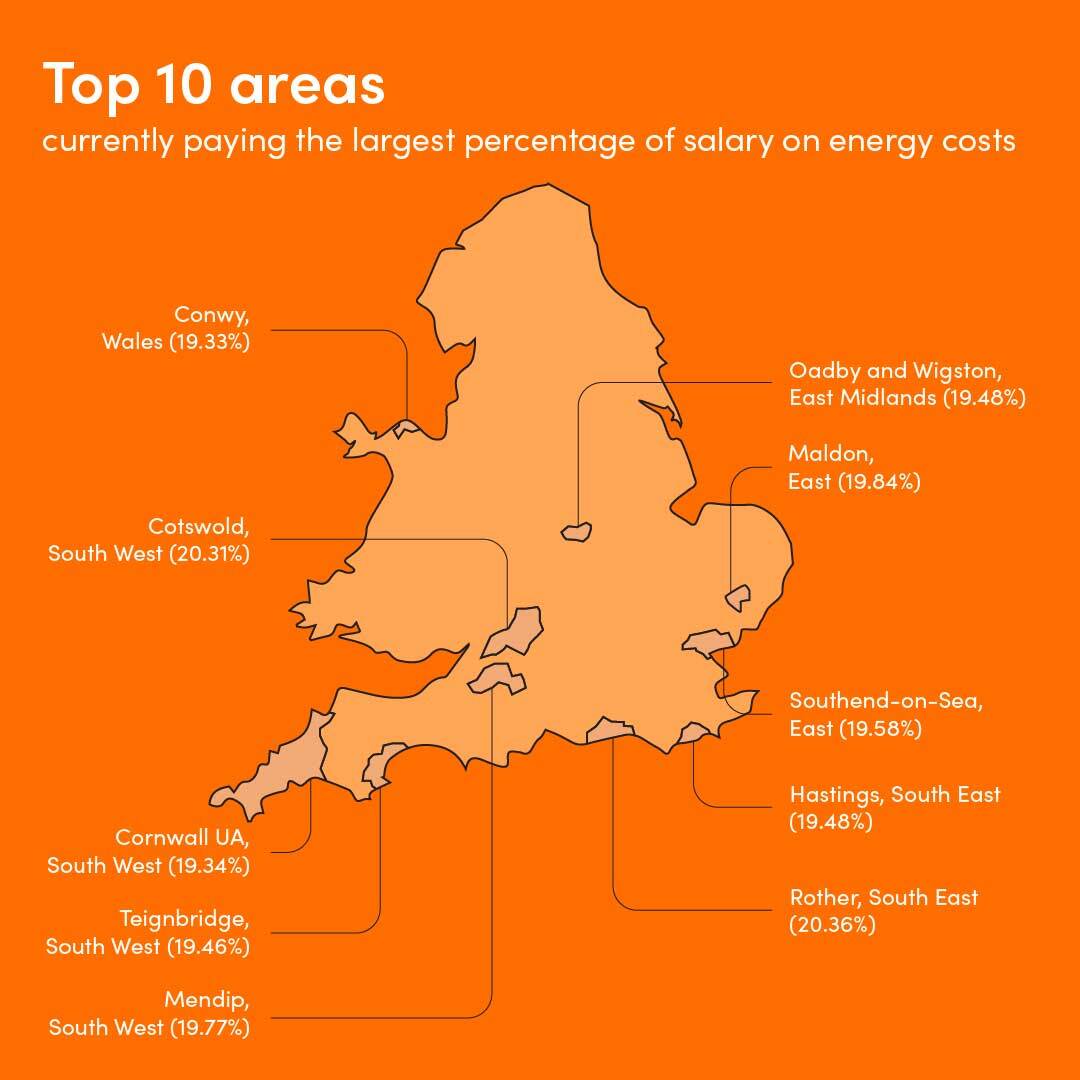
For the ten areas of the country currently paying the largest percentage of salary on energy costs, an October price rise of 80% would leave some areas spending over a fifth of their take-home pay on gas and electricity:
1. Rother, South East (22.21%)
2. Cotswold, South West (22.16%)
3. Maldon, East (21.65%)
4. Mendip, South West (21.56%)
5. Southend-on-Sea, East (21.36%)
6. Oadby and Wigston, East Midlands (21.26%)
7. Hastings, South East (21.25%)
8. Teignbridge, South West (21.23%)
9. Cornwall UA, South West (21.1%)
10. Conwy / Conwy, Wales (21.09%)
Before the recent April energy price cap increase, it was estimated that Brits would spend around 6% of their salary on energy bills – so by October, this proportion will have almost tripled.
What measures can be taken to soften the blow of rising energy costs?
While rising energy prices are just a part of the wider range of issues caused by the current cost of living crisis, albeit a big one, there is help available to customers struggling to cover the costs.
Starting from April 2022, the Government is offering an £150 Council Tax rebate to help with rising costs, accessible to those paying council tax in properties situated in Council tax bands A to D. Many households may have already received theirs.
For those born or on before 26 September 1955, the Government is also offering a Winter Fuel Payment of between £250 and £600. Eligible residents can apply for this from August 2022.
Additionally, Ofgem offers advice on actions to take if you’re struggling to pay your energy bills, to be taken up with your energy suppliers directly. Depending on circumstances, you may be eligible for extra help such as debt repayment plans, payment breaks or emergency credits.
If you’re looking for more tips on ways to minimise costs, you can check out our guide detailing the top 5 things you can do to reduce your energy bills.
If you’re in the position to explore ways to make your home more energy-efficient and ultimately save money, you may also want to consider ditching fossil fuels for good. Although gas is a cheap energy source per unit, there are other options that can work out less expensive in the long run and are also better for the planet.
Electricity is more expensive per unit, but electric heating is 100% efficient at point of use which means that every watt of electricity you use is converted into heat, and nothing goes to waste.
As an efficient and effective heating solution already used in many British homes, electric radiators are a great alternative to gas heating. They supply heat through a combination of convection and radiation and can also be paired with a green energy tariff for completely carbon neutral heating.

Key Takeaways
- According to Ofgem, the average UK energy bill under the new price cap is around £1,994 for direct debit customers.
- Households in the South West are spending the highest percentage of their salary on energy costs – with a typical household bill accounting for 10.47% of slary on average. While in some other areas such as the Midlands and the North West, people are spending less money on bills compared to their salary, however this is still 7-8% of their income on average.
- According to experts, the new increase could see prices rise by 65%.
- The government is offering help through incentives such as a Council Tax rebate and the Winter Fuel Payment.
- As a more efficient heating system, electric heaters may see an increase in popularity.
Sources:
- Average energy bill: https://www.ofgem.gov.uk/publications/price-cap-increase-ps693-april
- Typical consumption levels: https://www.ofgem.gov.uk/publications/decision-typical-domestic-consumption-values-2020
- Cost of gas and electricity and standing charges per region: https://www.theenergyshop.com/guides/compare-gas-electricity-prices-per-kwh
- Average gross salary per location: https://www.ons.gov.uk/employmentandlabourmarket/peopleinwork/earningsandworkinghours/datasets/placeofworkbylocalauthorityashetable7
- Average net salary per location calculator: https://www.thesalarycalculator.co.uk/salary.php
- Data doesn’t include Northern Ireland, energy price cap governs bills in England, Scotland and Wales
- Energy price cap predictions are an estimate based on research from https://www.theguardian.com/business/live/2022/jul/08/uk-jobs-market-economic-uncertainty-fuel-market-us-jobs-stock-market-ftse-pound-business-live